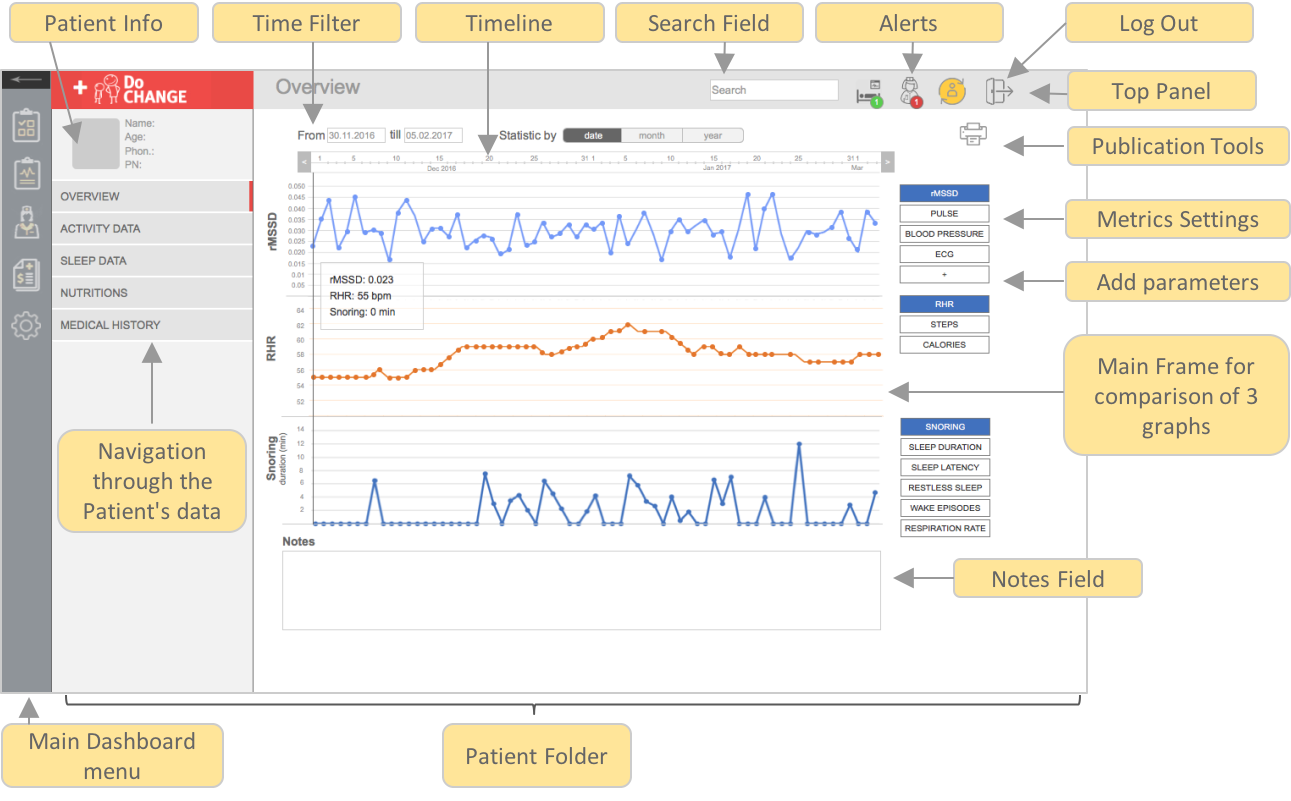
Dashboard for cardiologists
Do CHANGE
PROBLEM STATEMENT
The rehabilitation cardiologist needs to analyze a big amount of a patient's data in a short time straight before the meeting with patient. How to present these data in order to make the processing of an information more convenient for the doctor?
The rehabilitation cardiologist needs to analyze a big amount of a patient's data in a short time straight before the meeting with patient. How to present these data in order to make the processing of an information more convenient for the doctor?
Client
Omni BV, TU/e
Team
Interaction Designer, Project Manager, Computer Engineer
Duration
6 weeks
Do CHANGE project is funded by the European Commission project. The main objective of the project is to develop a life management ecosystem for improving health and wellbeing. The system will take account of a range of near real-time measurements including the patient's nutritional, health indices, and their behavioral habits. This breakthrough system integrates necessary behavior changes with measures from new portable devices and nutritional scanning tools for such things as salt and water. (c)
We received the Database at the disposal which collected the data of 50 participants about their physical activity (from two fitness trackers: Fitbit and Moves) and about their sleep (from sleep monitor Beddit) during a month.
1st CHALLENGE
What information from the trackers is relevant for cardiologists?
What information from the trackers is relevant for cardiologists?
For definition which variables from the trackers are relevant to cardiologists, we conducted interviews with 3 experts: 2 cardiologists and a cardiac nurse.
Main findings:
- Most heart attacks occur in sleep.
- Snoring is a risk factor for cardiac patients.
- Using fitness trackers allows for long-term monitoring of the patient's condition, which is costly when using a medical holter.
- Heart rate variability, as well as blood pressure, are the first variables that a cardiologist checks during a meeting with a patient.
2st CHALLENGE
How to visualize medical data?
How to visualize medical data?
For selected variables, we had to define the best representation that would be easy interpreted by clinicians during a short meeting with a patient.
We tried out different kind of graphs by processing the data from MongoDB the Database with D3.js.
The main problem that we faced while processing the data is gaps in the database which occur because of unstable work of the trackers.
Google Sprint
During 3 days of design sprint, we went through the stages of long-term goal definition, the process flow mapping and different sketching. We asked experts what are the most important questions for our design and came up with three concepts regarding placing of information in the dashboard.
C1: Customizable interface with the set of widgets that would visualize the daily summary of selected variables.
C2: Tiles interface with prevailing graphic content instead of text explanation.
C3: Tab interface with separated information for physical activity at a daily time, at night and about consumed nutrients.
C2: Tiles interface with prevailing graphic content instead of text explanation.
C3: Tab interface with separated information for physical activity at a daily time, at night and about consumed nutrients.
Interactive graphs, chat box, filter controls and structuring data according to activity in a day and in a night and nutrition intake had considered as the most interesting for further implementing.
Prototyping
We took into account the interesting point from other 2 concepts, like: timeline, chat box for communications between the doctors and nurses and the idea of dashboards customization for certain needs, specifically for different specialists (nutritions and physiotherapists) the dashboard should contain different parameters by default.